
Overview of key concepts about process instrumentation: Measurement accuracy (a static characteristic that determines the degree of agreement between the instrument indicator and measurement properties in measurement or monitoring), measurement uncertainty, measurement verification, and calibration
Measurement forecast
:The purpose of accurate measurement
-
According to ISO-IMV (International Vocabulary of International Assessment): “… Proximity of agreement between signs or measured values obtained by similar measurements in the same objects or under certain conditions”
-
According to IEC-IEV (International Electrotechnical Vocabulary): “.. a quality that indicates the ability of a measuring instrument to provide a specified value close to a real measurement value”. Accuracy);
-
Or we can deduce the following practical definition from the previous ones: “آزمایش By testing a measuring instrument under certain conditions and by specified methods, the maximum positive and negative deviations from a given characteristic curve (usually a straight line)”.
Thus, the concept of linearity is also inherent in the term precision measurement (which is currently very limited in digital precision instruments), while the concept of hysteresis is not included (although this is considered because in the maximum positive and Negative included (deviation found)
In addition, the concept of measurement reproducibility is not included (which instead takes into account the accuracy of accuracy in several measurement cycles. Therefore, in the practical verification of the accuracy of measuring instruments with a single up and down measurement cycle) Which is usually done for instruments with hysteresis, such as pressure gauges, pressure transducers, load cells, etc.) is obtained from the calibration curve, the type in Figure 1, where the concept of accuracy can be tested (measured accuracy) Which should be inferred in the term nominal accuracy (called accuracy) or the ranges in which the inaccuracy of a tool with its specifications is guaranteed .. Confirmation Maintains the measurement process over time.This notion of inaccuracy is sometimes referred to as the accuracy class for some common types of instruments (such as gauges, resistance thermometers, thermocouples, etc.), which according to the ISO-IMV and IEC-IEV International Reference Terms: Measurement or measuring systems in accordance with the stated measurement requirements, which intend to keep the measurement errors or measurement uncertainties of the instrument within a certain range under certain operating conditions ”(ie, the measured accuracy must be less than the accuracy.

Figure 1 – Description of the concepts of measurement accuracy
Unreliability
Uncertainty of measurement The measuring instrument is a new concept that not only finds errors or deviations during calibration, but also shows its clarity and also considers the uncertainty of the measurement standard used in the calibration itself.
:Measurement of uncertainty
According to ISO-GUM (Measurement Uncertainty Guide): “The result of an estimate that determines the amplitude of the field in which the actual value of a measurement should be located is generally determined by a certain probability, that is, by a level. Self Confidence “
-
According to ISO-IMV (Internat. Metrology Vocabulary): “A non-negative parameter that assigns the scatter of quantitative values to a measurement based on the information used.”
-
According to ISO-GUM (Measurement Uncertainty Guide): “The result of an estimate that determines the amplitude of the field in which the actual value of a measurement should be located is generally determined by a certain probability, that is, by a level. Self Confidence “
From the above definitions, we can measure two basic concepts of uncertainty:
1- Uncertainty is the result of an estimate that is evaluated according to the following two types:
-
Category A: When evaluation is done by statistical methods, ie through a series of repeated observations or measurements.
-
Category B: When the evaluation is done using non-statistical methods, ie data that you can find in booklets, catalogs, specifications, etc.
2. The uncertainty of the estimate should be presented with a certain probability, which is usually presented in the following three terms (see also Table 1):
-
Standard Uncertainty (u): 68% probability or confidence level (exactly 68.27%).
-
Combined Uncertainty (UC): The standard uncertainty of the measurement when the result of the estimate is obtained using the values of different values and is in accordance with the summation in the quadrangle of standard uncertainties in different values related to the measurement process.
-
Wide Uncertainty (U): Uncertainty at the 95% probability or confidence level (exactly 95.45%), or 2 standard deviations, assuming a normal or bull probability distribution.
Standard uncertainty (x) (a)
Uncertainty of the measurement result expressed as a standard deviation (x) º s (x)
Type A assessment (uncertainty
Method of estimating uncertainty by statistical analysis of a series of observations
Type B assessment (uncertainty
Uncertainty assessment method other than statistical analysis of observational series
Uncertainty of standard uc (x
The standard uncertainty of a measurement result when that result is obtained from the values of a number of other values is equal to the positive square root of one of the terms, these terms are the variance or variability of these other values depending on how they weigh. Making is different by changing these quantities
Coverage coefficient k
A numerical coefficient used as a multiplication in the combined standard uncertainty to obtain extended uncertainty (typically 2 for probability @ 95% and 3 for probability @ 99)
Uncertainty U (y) = k is extended. (uc (y) (b
The value of the time interval definition for the measurement result that one might expect is a large part of the distribution of values that can logically be assigned to the receiver size (including definitely multiplied by the uncertainty of the hybrid standard with a coverage coefficient of k = 2 Brought). That is, with a 95% probability of coverage)
(A) The standard uncertainty u (y), ie the mean square deviation (x), if not detected experimentally by a normal or Gaussian distribution, can be calculated using the following equations: u (x) = a / Ö3 , For rectangular distributions, with amplitude changes ± a, for example sign errors u (x) = a / Ö6, for triangular distributions, with amplitude changes ± a, for example interpolation errors (b) measurement uncertainty The measurement U (y), unless otherwise specified, must be prepared or calculated from the uncertainty resulting from the coverage factor 2, ie with a probability level of 95%.
Metrological verification
Measurement verification is a routine operation and control that verifies that the measuring instrument (or equipment) maintains the accuracy and uncertainty necessary for the measurement process over time. Measurement verification means in accordance with the ISO 10012 standard (Mgt measurement system): “a set of intertwined or reciprocating elements necessary to achieve measurement verification and continuous control of measurement processes”, and in general includes options below:
Measurement verification is a routine operation and control that verifies that the measuring instrument (or equipment) maintains the accuracy and uncertainty necessary for the measurement process over time. Measurement verification means in accordance with the ISO 10012 standard (Mgt measurement system): “a set of intertwined or reciprocating elements necessary to achieve measurement verification and continuous control of measurement processes”, and in general includes options below:
-
Calibration and verification of tools;
-
Any necessary adjustments and new conclusions,
-
Comparison with measurement requirements for intended use of equipment;
-
Labeling in confirmation of positive positive assays.
 Measurement verification should be ensured through a measurement management system, which basically includes the steps in able 1.
| NORMAL PHASES | PHASES IN CASE OF ADJUSTMENT | PHASES IN CASE OF IMPOSSIBLE ADJUSTMENT |
| 0. Equipment scheduling | ||
| 1. Identification need for calibration | ||
| 2. Equipment calibration | ||
| 3. Drafting of calibration document | ||
| 4. Calibration identification | ||
| 5. There are metrological requir. ??? | ||
| 6. Compliance with metrological req. | 6a. Adjustment or repair | 6b. Adjustment Impossible |
| 7. Drafting document confirms | 7a. Review intervals confirm | 7b. Negative verification |
| 8. Confirmation status identification | 8a. Recalibration phase (2 to 8) | 8b. State of identification |
| 9. Satisfied need | 9a. Satisfied need | 9b. Need not satisfied |
Table 1 – Main steps of measurement verification (ISO 10012)
:Table 1 highlights three possible ways to validate sentimentality
-
The left path, which normally achieves satisfaction with the positive result of the measurement confirmation without any adjustment of the instrument in the confirmation to step 6.
-
The first left and then the middle path from phase 6a to 9a, if positively adjusted or restored by the validator, will satisfy that confirmation: therefore, in this case, only the reduction of the approval distance is necessary;
-
The first path on the left and then on the right from phases 6b to 9b, in the event of a negative adjustment or restoration in the verification, which does not satisfy the verification result: therefore the instrument must be lowered or alienated.
Verification of measurements can usually be done in two ways:
Comparison of maximum relief error (MRE) with maximum tolerance error (MTE), ie: MRE <= MTE
Compare Max. Uncertainty (MRU) with tolerance uncertainty (MTU, ie: MRU <= MTU
Based on the previous content and taking into account the existing cases of calibration, related to the evaluation of calibration results in terms of error and uncertainty of a manometer, are equal, respectively:
- MRE: ± 05 bar
- MRU: 066 bar
If the maximum error and the uncertainty of the tolerance are both 0.05 times, then the manometer corresponds if it is evaluated in terms of MRE, while if it is evaluated in terms of MRU it does not correspond and therefore it has to follow path 2 of table 1 or path 3. ; If it does not enter, it goes down.
Tool calibration
Instrument calibration is the practice of obtaining, under certain conditions, the relationship between the measured values and the corresponding output signals of the device in the calibration.
:Order of calibration
-
According to ISO-IMV (International Vocabulary of International Measurement): Establishes a related measurement and in a second step, uses this information to establish a relationship to obtain the measurement result of the sign.
-
Or we can deduce the following practical example from the previous example: “An operation performed to establish a relationship between a measured value and the corresponding output values of an instrument under certain conditions.”
 Calibration should not be confused with setting, meaning that: “A set of operations performed on a measuring system in such a way that the prescribed marks correspond to the given values of a value for measurement (ISO-IMV) Offer. Hence, setting is usually the initial operation before calibration, or the next operation if de_calibration is found from the measurement tool. Calibration should be performed at 3 or 5 suitable measurement points to increase (and decrease) values for instruments with a hysteresis phenomenon (eg manometer): Figure 1 shows the calibration adjustment, while Table 1 presents the calibration results. Has been.
 Manometer adjustment calibration
Figure 1 – Calibration adjustment of a manometer
| Pressure of reference (bar) |
Relieved Values |
Relieved Errors |
Max Relieved Error (bar) |
||
| Up (bar) |
Down (bar) |
Up (bar) |
Down (bar) |
||
| ۰ | – | ۰.05 | – | ۰.05 | ۰.05 |
| 2 | 1.95 | 2.05 | – 0.05 | ۰.05 | |
| 4 | 3.95 | 4.05 | – 0.05 | ۰.05 | |
| 6 | 5.95 | 6.00 | – 0.05 | 0.00 | |
| 8 | 7.95 | 8.00 | – 0.05 | 0.00 | |
| 10 | 10.00 | – | 0.00 | – | |
From the calibration results shown in Table 1, the measurement characteristics of the manometer (or barometer) can be considered in terms of:
-
Measurement accuracy: ie maximum positive and negative error: 0.05 bar
-
Uncertainty of measurement: or instrumental uncertainty that takes into account various factors related to calibration, ie:
I ref Uncertainty of the reference standard 0.01 bar (supposed)
E max Max error of measurement relieved 0.05 bar
E res Error of resolution of the manometer 0.05 bar
from which the composed uncertainty u c can be derived from the following relation:
 :And then the uncertainty (U), at the 95% confidence level (ie at 2 standard deviations)
![]() Note: It is obvious that the measurement uncertainty of the manometer (usually instrumental uncertainty) is always higher than the measurement accuracy (because it also takes into account the error of the device in calibration and the uncertainty of the reference standard used in the calibration process). ). In this paper, standard analog pneumatic signals (20 to 100 kPa) and electrical signals (4 to 20 mA) as well as HART hybrid analog and digital signals (remote control converter highway) and digital art status The current is explained. Communication protocols are commonly called BUSs.
Note: It is obvious that the measurement uncertainty of the manometer (usually instrumental uncertainty) is always higher than the measurement accuracy (because it also takes into account the error of the device in calibration and the uncertainty of the reference standard used in the calibration process). ). In this paper, standard analog pneumatic signals (20 to 100 kPa) and electrical signals (4 to 20 mA) as well as HART hybrid analog and digital signals (remote control converter highway) and digital art status The current is explained. Communication protocols are commonly called BUSs.
CONTROL SIGNALS: ANALOG, HYBRID, DIGITAL
Analog control signals
:The most traditional transmission signal type
-
Direct current signals (Table 1): For connecting between instruments over long distances (for example in the field area)
-
Direct voltage signals (Table 2): For short-distance connection between devices (eg in control room)
| LOWER LIMIT (mA) | UPPER LIMIT (mA) |
| ۴ ۰ |
20 20 |
| (1) Preferential signal | |
Table 1- Standard signals in direct current (IEC 60381-1)
| LOWER LIMIT (V) |
UPPER LIMIT (V) |
NOTE |
| ۱ – ۱۰ |
5 5 10 + 10 |
(1) (1) (1) (2) |
| (1) Voltage signals that can be derived directly from normalized current signals
(2) Voltage signals that can represent physical quantities of a bipolar nature |
||
Table 2 – Standard signals in direct voltage (IEC 60381-2) Signals other than 0 (live zero) for the variable at the beginning of the measurement range (true zero), for electrical instruments to power the instrument and in general to highlight losses Connection (such as pneumatic tools) is used. In addition, due to their characteristics, current signals are used in instrumentation, while voltage signals are used in technical instruments and room control. Finally, the current signal has the advantage of not being affected by the length with respect to the voltage signal, and hence the connection line impedance is at least up to certain resistance values, as shown in Figure 1.
 Figure 1 – An example of the operating range for field-specific instruments in terms of their omega-to-supply voltage V supply voltage.
Key:
- Vdc = Actual supply voltage in volts
- Vmax = Maximum supply voltage, 30 V in this example
- Vmin = Minimum supply voltage, 10 V in this example
- RL = Max. load resistance in ohm at the actual supply voltage:
- RL <= (Vdc – 10) / 0.02 (in the Example reported in Figure 1)
Combined control signals
Combined signals, in the form of digital analog protocols, were standardized by a consortium of “de facto” manufacturers: HART (Remote Controlled Highway), which adds exactly to the normal analog signal (20 x 20 mA), a digital signal. According to the Bell 202 standard with a range of 0.5 mA and with the frequency in Table 3 is adjusted in frequency. Due to the high frequency of the installed signal, the added energy is almost zero, so this modulation does not cause any disturbance to the analog signal. Note: Remember that you need a 250 ohm resistor in the output circuit to run the HART protocol !
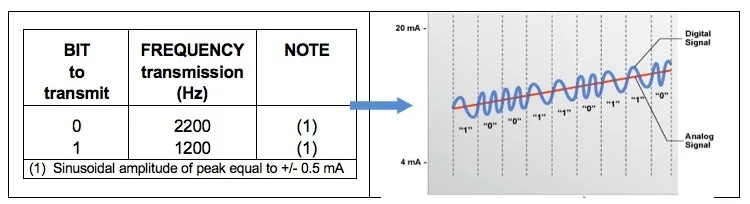 Table 3 – HART protocol with standard signals BELL 202
Digital control signals
Digital signals were standardized in the Fieldbus protocol by the international standard IEC 61158 in the late 1990s, but are not yet widely used because they standardize communication protocols, and each digital protocol is essentially characterized by the following features: See Table 4):
-
Receiver encryption: introduction, frame start, frame transfer, frame end, transfer parity, and so on.
-
Network access: probabilistic, definite, etc.
-
Network management: Master-Slave, producer-consumer, etc.
| PROTOCOL IEC 61158 |
PROTOCOL NAME |
NOTE |
| 1 2 3 4 5 6 7 8 |
Standard IEC ControlNet ProfiBus P-Net Fieldbus Foundation SwiftNet WorldFip InterBus |
(1) |
| (1) Protocol initially designed as unique standard protocol IEC | ||
Table 4 – Standard protocols provided by International Standard IEC 61158
Finally, Figure 2 shows the geographical path of the measurement signals from the “section” to the “control room” through the “technical room”, where sorting (also called “marshaling”) takes place. The current signal is converted into a voltage signal for the controller (DCS: Distributed Control System) and then transmitted through digital signals in the “control room” for the station and the operator (HMI: human machine interface).
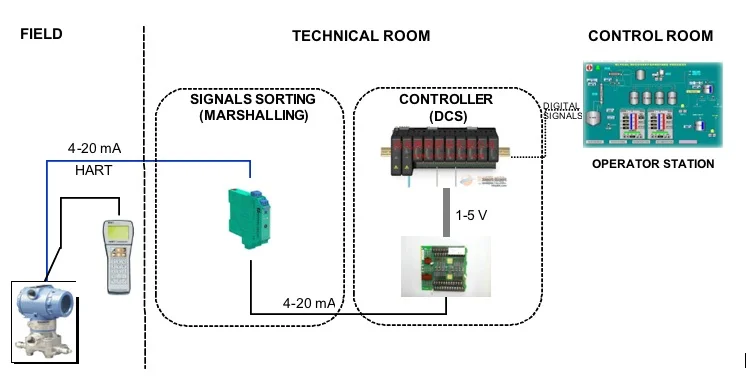 Figure 2 – The typical path of a measuring chain from the field to the control room
Installed power supply
-
For pneumatic tools: 10 140 140 kPa (1/1 1.4 1.4 times) For pneumatic tools (sometimes the normal pneumatic power supply is used in English units: 20 PSI, corresponding to the 1.4% bar)
-
For electrical equipment: DC voltage: 24V DC for instrumentation, AC voltage: 220VJ for control and instrumentation room
Connections and transmission signals between different instruments in the measurement and tuning chains are performed by the IEC (International Electrotechnical Commission) as standard:
-
Pneumatic signals (IEC 60382): 20 to 100 kPa (0.2 to 1.0 bar) (sometimes the standard signal is still in English units: 3 to 15 psi, 0.21 1.0 1.03 bar)
Rose Calibration Company in Melbourne, Australia with over ten years of experience provides all calibration, maintenance, and repair services throughout Australia. If you live in Sydney, Melbourne, Adelaide, Perth, Geelong, and Brisbane, you can receive your quote in less than two hours by fill-up the form via the “Booking” link.